Power Measurement Platform
Presentation
Info
This first section was originally hosted here: https://largo.lip6.fr/trac/soc-conso.
Evaluating software impact on power consumption is not easy. Using a simple multimeter on the power line is not accurate enough because there are big variation in input current. A higher sampling frequency is needed. Also you have to correlate the power data with the various phases of a software (separate initialization from the computation part for example).
Our idea is to build a low-cost power measurement tool around a cheap microcontroller, in this case from the pic18 family. We use its ADC to get current and voltage sample of the power line at a high enough rate. We also use its GPIOs as input, connected to GPIOs of the SoC being evaluated, to track and report various software state on the SoC.
We choose to use a pic18fj53. Its has a 12 bits ADC which can do up to 80 ksp/s, runs at 48 Mhz and has a USB interface. Our plan was to use the USB interface to transfer the data to the host. Unfortunately during development we found that the USB interface, when enabled, would dramatically decrease the ADC's accuracy. So we choose to use the serial port on the PIC side and added an external USB/serial bridge. The electronic gets power from the USB connection, the external power supply being used only for the SoC being monitored.
The requirements are:
- inputs between 0 and 2 A, 0 and 20 V,
- 4 GPIOs to connect with the SoC being evaluated.
We came up with the following schematic (PDF version):

Hardware and software sources are available in the following SVN repository: https://www-soc.lip6.fr/svn/soc-conso/.
A 1.235 V precision diode is used as a voltage reference for the ADC. The input voltage is feed to ADC input 0 (AN0) via a voltage divider. To cover the input range with enough accuracy 3 different values can be selected with a jumper.
3 Shut resistors are used for current measurements, selectable with a jumper. An amplifier will multiply the shut's voltage before feeding it to AN1.
RB0-RB3 are used to get 4 GPIO status from the SoC.
Each sample reported to the host is composed of 3 values: GPIO state (integer between 0 and 15), voltage (AN0 value between 0 and 4095) and current (AN1 value between 0 and 95), in the format: gvvvcccX, with g, v and c being hexadecimal digits and X being the letter X used as separator. With 8 bytes per sample, at 921600 bauds we could report in theory up to 11520 samples/s. To be safe we choose to run at 5000 samples/s (which requires 10000 A/D conversions/s).
Calibration and Performance
For the calibration process, I used a good linear power supply (both current and voltage adjustable) and a 4000 points digital multimeter. A switching power supply was not good enough, ripple noise impacted values reported by our circuit.
For voltage input, we selectable 3 divider values: 4.92, 11 and 19.33, which gives ranges of 6.07 V, 12.35 V and 23.88 V respectively.
For current input, we have 3 selectable shuts: 0.05, 0.1 and 0.2 ohms. The shunt's voltage is then amplified by 10 by the AD623 amplifier. This gives ranges of 2.45 A, 1.23 A and 0.61 A respectively.
For each tension or current range, we take 8 samples between 0 and a value close to the max of the range. For each sample we get a few thousand values from pic's output, while we note the real value using the digital multimeter.
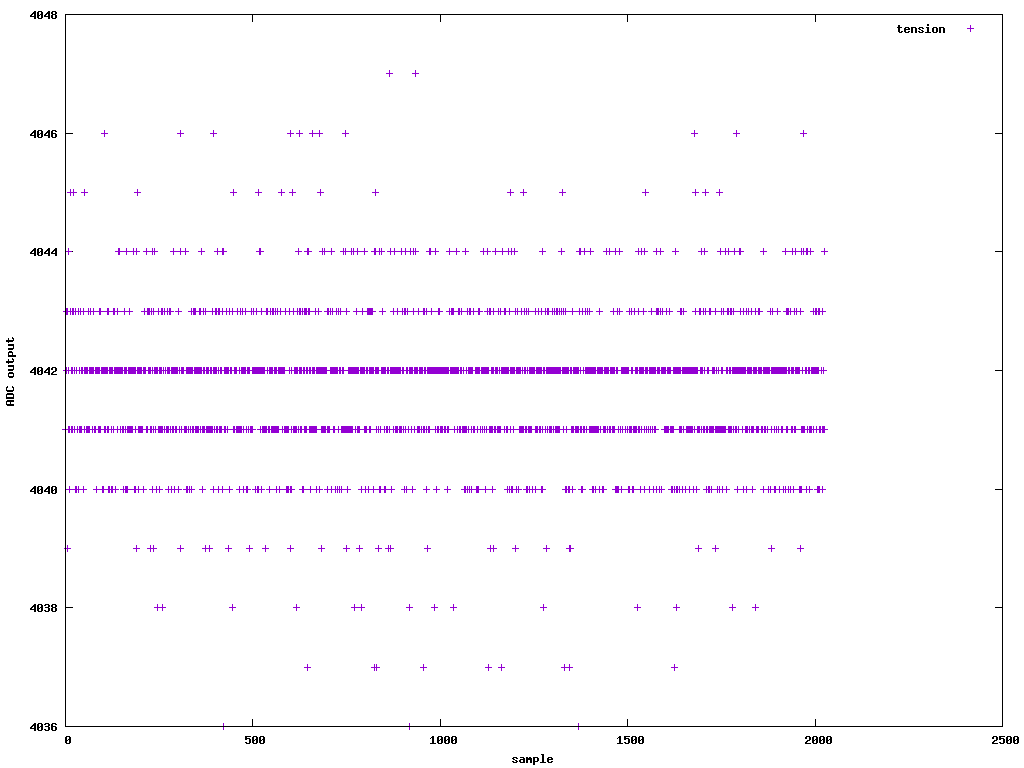
From this process, we found that that the AD623 output can't go down to 0, it stays positive by anout 5.5mV. This means we can't measure currents smaller than 2.75 mA on the 0.61 A scale, and 11 mA on the 2.45 A scale. We also find that, assuming an ideal power supply without noise or ripple, we have a +/-7 unit error on the ADC's output for current values. This is less than 0.18% of the full range (or +/- 4.4 mA on the 2.45 A range input). Below are plots for measures on the 0.61 A scale.
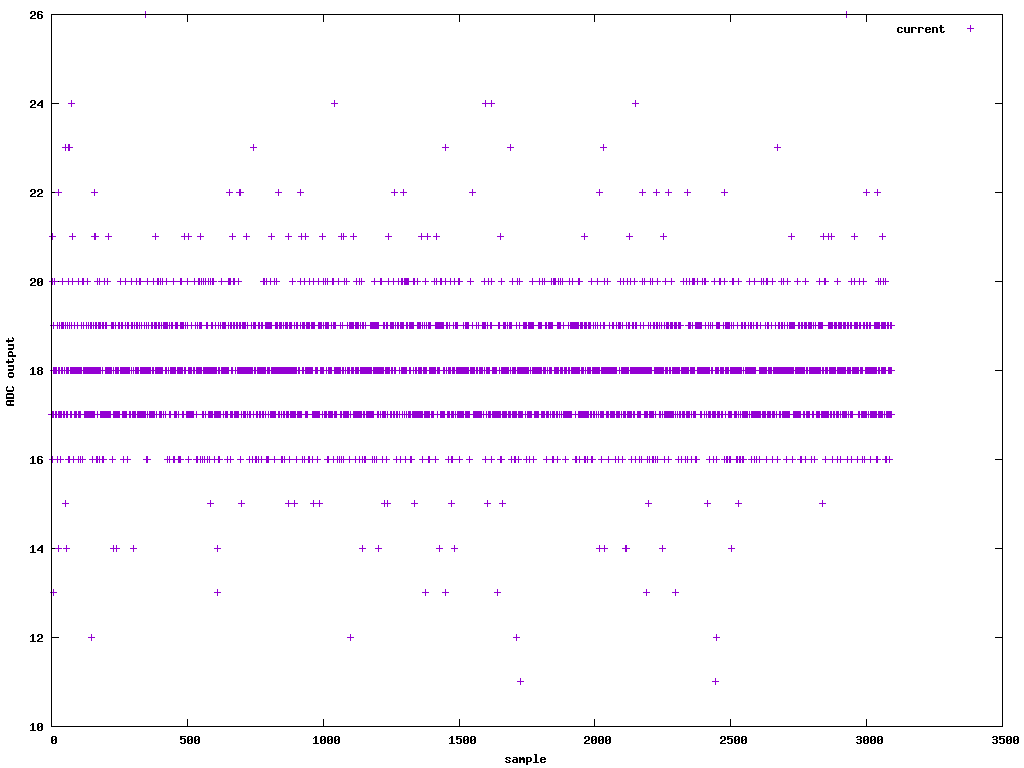
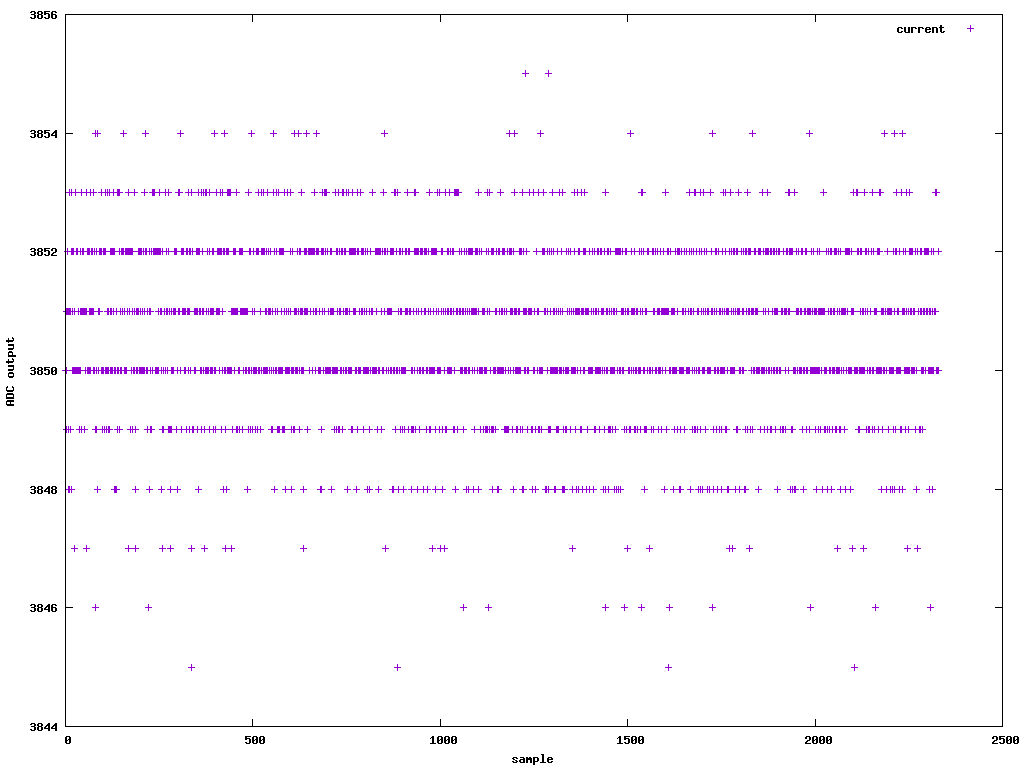
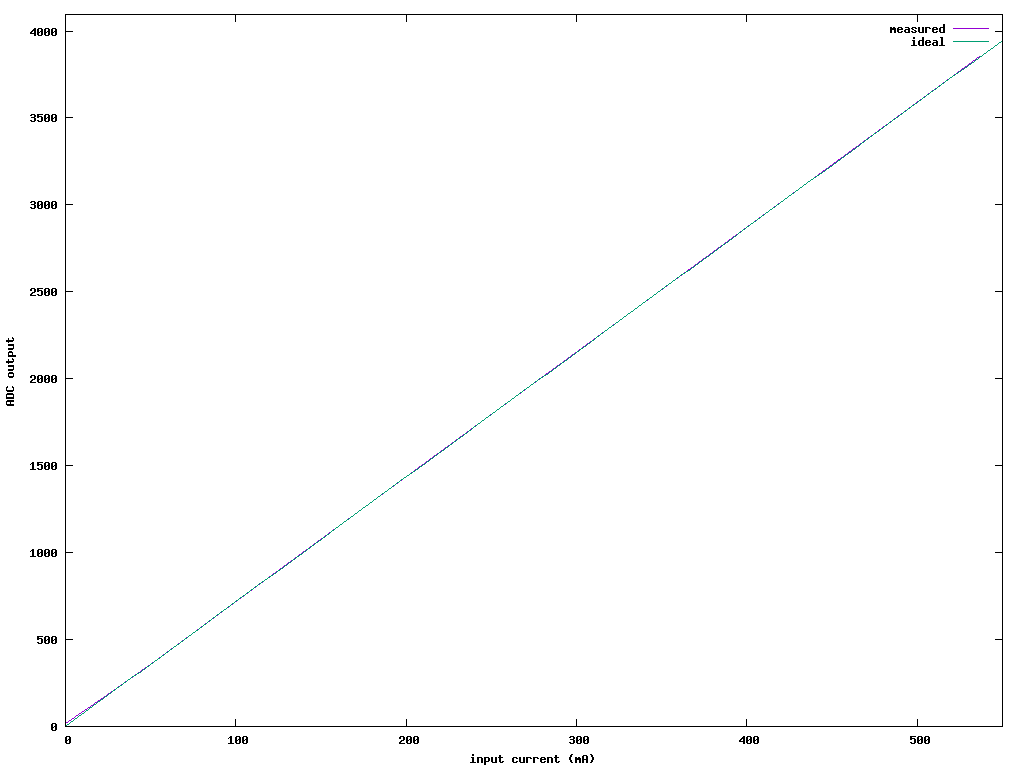
From the 536.7 mA measure we have a 8% error for the ADC's output (we expect 3559, we get 3851). We can use this to correct our conversion ratio: \(adc(i) = 3851 / 536.7 \times i\) (with \(i\) in mA). With this conversion function, and excluding the value at 0 mA, the error with the measured ADC output is at most 4, which is within the noise.
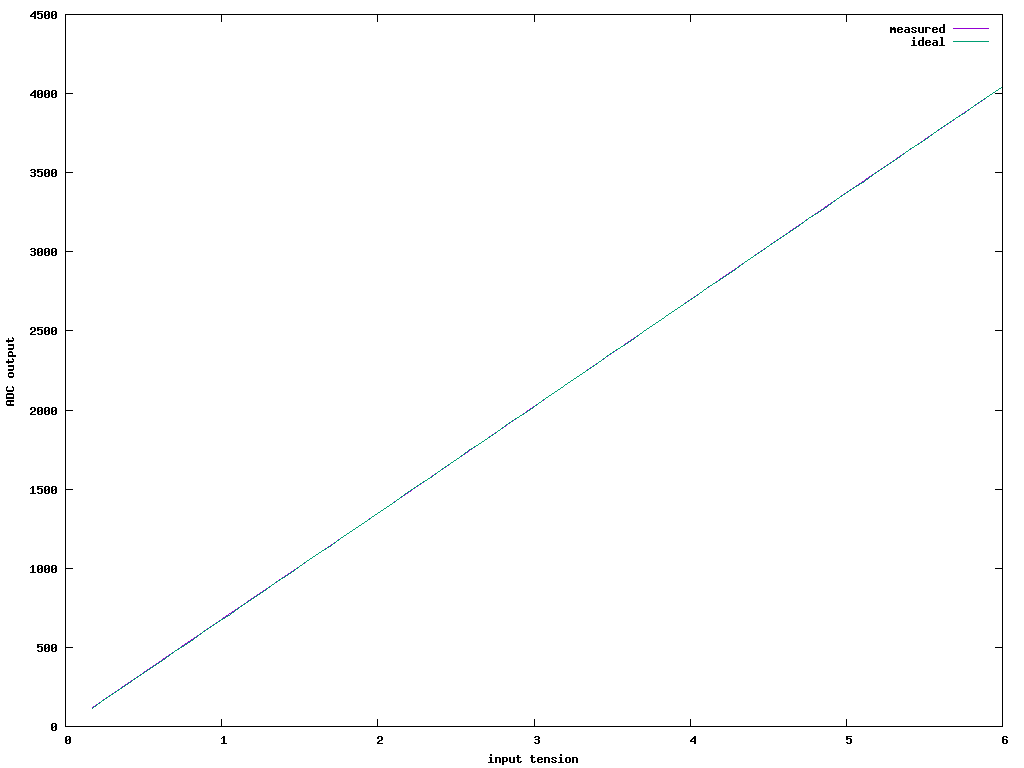
We repeated the process for the tension inputs. Here we have a +/-5 unit error on the ADC's output for voltage inputs. This is less than 0.13% of the full range (or +/- 29 mV on the 23.88 V range). Below are plots for measures on the 6 V scale.
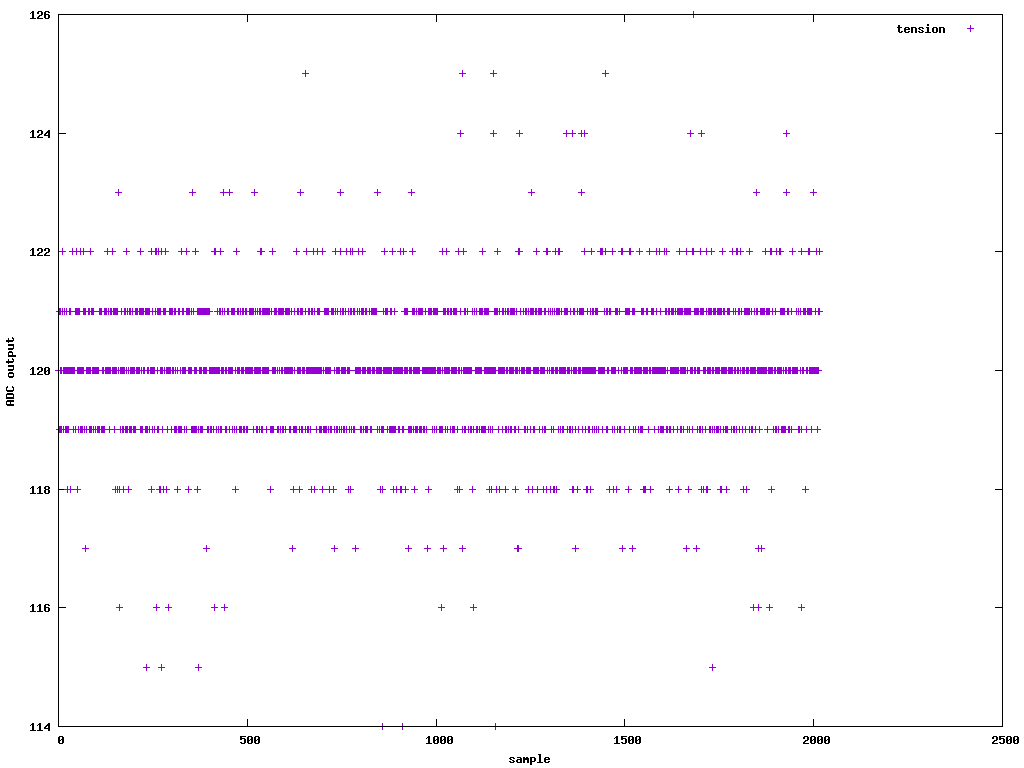
For 5.996 V, we expect 4045 at the ADC output and we did read 4041 0r 4042. This is less than 0.1%. As for current we use the 5.996 V result to fix our conversion ratio: \(adv(v) = V \times 4041.5 / 5.996\). With this function, the error with the measured ADC output is at most 5.
Version 2
The version 2 of the hardware got several improvements:
- As the USB part of the pic18 is not used, we switched to a pic18f27j13
- There are now 8 GPIOs available.
- A 4th current range (up to 5 A) has been added.
- The USB/serial part is electrically decoupled from the target board, to avoid possible ground loop affecting current values. The USB/Serial bridge is powered from USB, while the pic18 is powered from the load power supply.
- The pic18 can power on or off the load.
- The pic18 controls two solid state relays, which can drive e.g. power or reset switches for the target board.
- The pic18 has one optocoupled input, which can monitor e.g. a power led from the target board.
- A second serial port is available from the pic18, which can be used to connect to a TTL-level serial console on the target board, avoiding an extra serial/USB converter.
The software also got major reworks. To use the new features, a bidirectional connection is now needed. We also used this opportunity to store calibration value in the pic18's flash, so we don't need to match a board with its calibration values on the host's side. The USB/serial port of the board runs at 921600 bauds. The board accepts the following commands from the host:
B<n>connect to the target's serial port at speed \(n\). If \(n\) is omitted, use the previously set speed. exit with#.Cget calibration data.C<string>set calibration data string. It is just a string stored in flash and echo'ed back on request; it's up to the host software to interpret it. In order to keep the firmware simple, the string has to be exactly 83 char longs, and can hold only digits,.or spaces.Ecauses the firmware to exit, resetting the pic18.Mnwith \(n\) being1or0: start or stop measures.Pnwith \(n\) being1or0: power on or off the load.Rrnwith \(r\) being1or2and \(n\) being1or0: turn on/off relay \(r\).Sget various input states.
Each command is replied with OK, unless and error occurred.
Host software getting values from the board now has to start measures with M1
first; it should also send M0 before exiting.
Configuration of the Measurement Platform
This section explains how to configure the measurement platform (version 2) for a new SBC.
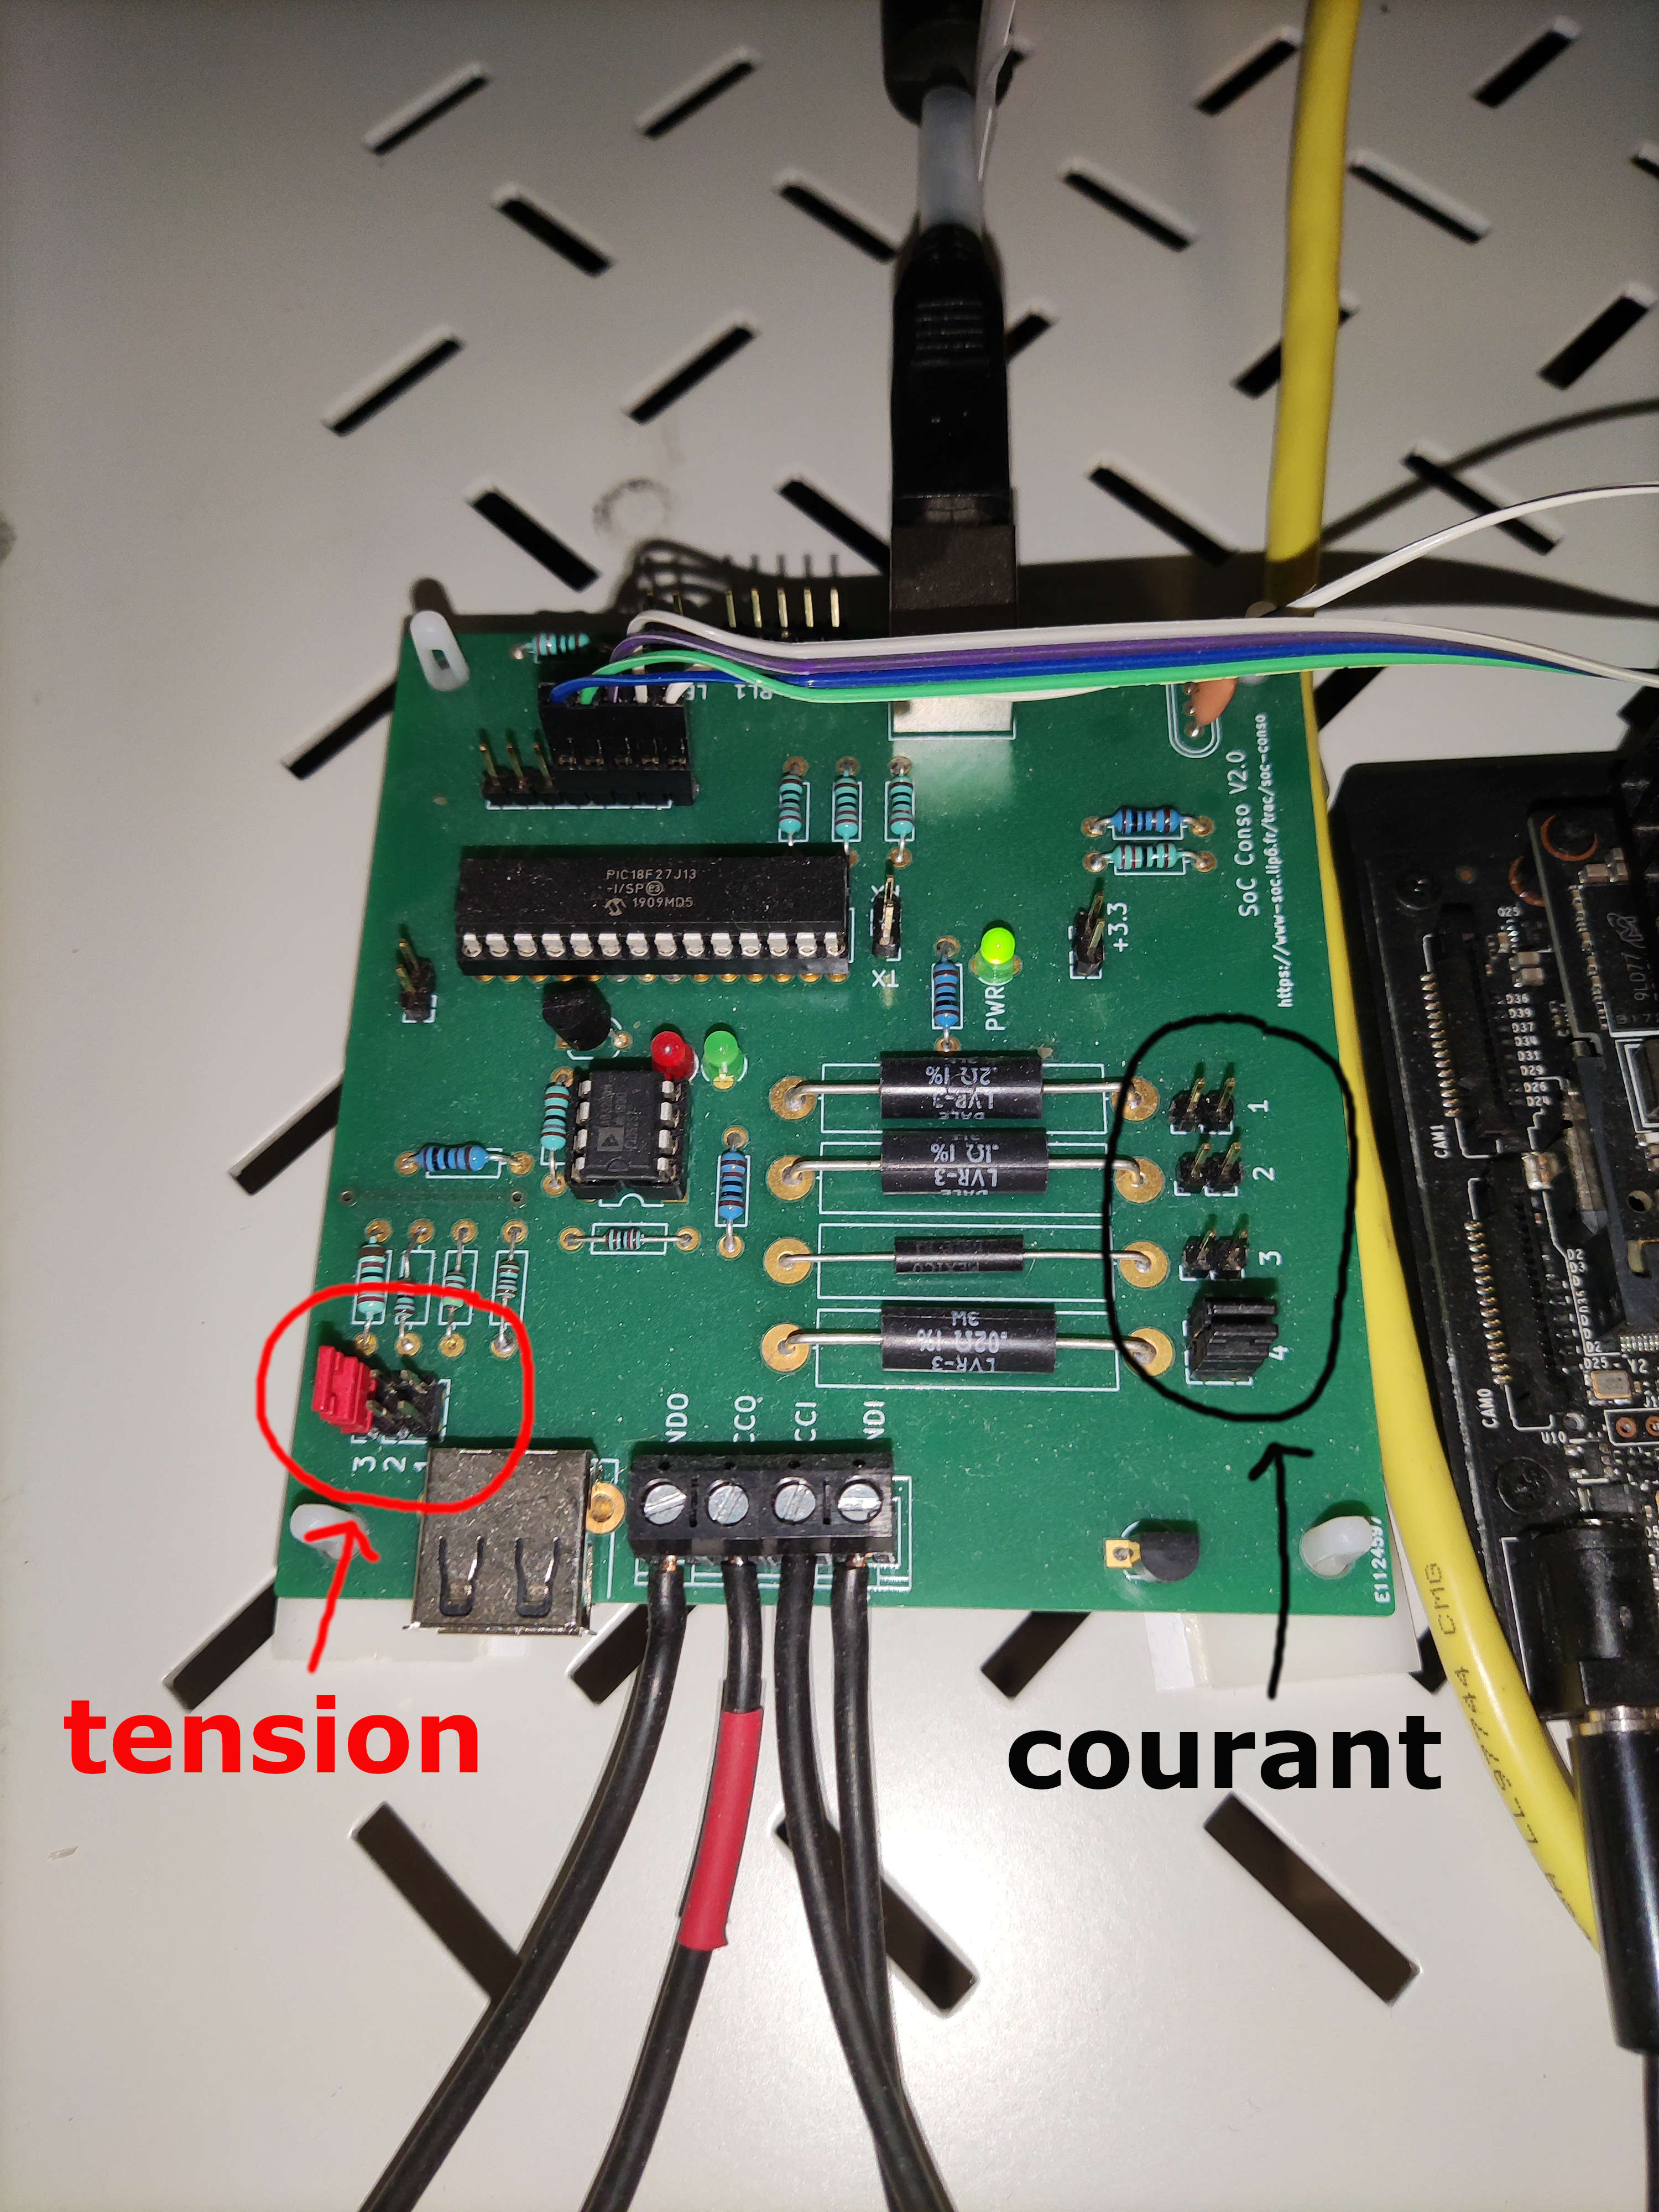
The Platform possesses two jumper types :
- the red one : controls supported voltage with 3 possible positions,
- the black one(s) : controls supported intensity with 4 possible positions.
Voltage (red) :
- position 1 : from 0 to 6.07 V,
- position 2 : from 1 to 12.35 V,
- position 3 : from 2 to 23.88 V.
Note
It's best to use the interval closest to the supply voltage to improve measurement accuracy. For example, for a voltage of 5 V, all positions could be used, but position 1 will result in a more accurate measurement of energy consumption.
Intensity (black) :
- position 1 : max 0.61 A,
- position 2 : max 1.23 A,
- position 3 : max 2.45 A,
- position 4 : max 4.90 A.
Warning
In positions 1, 2 and 3, a single black jumper is used, while in position 4 both black jumpers need to be used.
Configuration on the Fronted :
/opt/power-tools/boards/boardX/tension: must contain the number corresponding to the number of the voltage jumper (red) on the measurement platform/opt/power-tools/boards/boardX/current: must contain the number corresponding to the intensity jumper (black) on the measurement platform
Note
X corresponds to the number of the measurement platform. These numbers are written on labels in the Monolithe.
Setting up GPIOs
The GPIOs control the first value of each measured sample, thus allowing to identify specific parts of the running benchmark. Three steps are mandatory to set up a GPIO on the operating system.
-
Export the desired pin in the sysfs :
where DRIVER_GPIO is the Pin ID given by the driver (column Driver GPIO ID of the next table). For instance, on Jetson Orin Nano, DRIVER_GPIO is 453 for the pin 29. -
Set the pin direction
where SYSFS_GPIO of the previous example is PQ.05.
-
Set write permissions and add symbolic link
sudo chmod o+rw /sys/class/gpio/SYSFS_GPIO/value
sudo ln -s /sys/class/gpio/SYSFS_GPIO/value /sog/gpio/pinX
where X is the number of the pin in table below (usually 1, given
/sog/gpio/pin1).
Connected pins
| Board Name | Pin 1 | ||
|---|---|---|---|
| GPIO Pin | Driver GPIO ID | GPIO SYSFS | |
| Odroid-XU4 | 26 (GPIO24) | 24 | gpio24 |
| Jetson TX2 | |||
| Jetson AGX Xavier | 22 | 417 | gpio417 |
| Jetson Nano | 19 (SPI_1_MOSI) | 16 | gpio16 |
| Raspberry Pi 4 Model B | 40 | 21 | gpio21 |
| Jetson Xavier NX | |||
| Jetson Orin NX | 29 (GPIO01) | 453 | PQ.05 |
| Jetson AGX Orin | 13 (GPIO32) | 456 | PR.00 |
| Jetson Orin Nano | 29 (GPIO01) | 453 | PQ.05 |
| Orange Pi 5 Plus | 10 (GPIO1_A0) | 32 | gpio32 |
Power Tools Installation
This section details how to install the power tools to communicate with the measurement platforms described at the top of this page.
On the frontend, get and compile the code to communicate through UART:
sudo apt-get install subversion
svn checkout https://largo.lip6.fr/svn/soc-conso # requires LIP6 web account
cd soc-conso/trunk/software/tty
gcc -O3 -o readtty_power readtty_power.c
gcc -O3 -o readtty_timer readtty_timer.c
gcc -O3 -o readtty_command readtty_command.c
Install the compiled code in the /opt/power-tools folder:
sudo mkdir /opt/power-tools
sudo mkdir /opt/power-tools/bin
sudo mv readtty_power /opt/power-tools/bin
sudo mv readtty_timer /opt/power-tools/bin
sudo mv readtty_command /opt/power-tools/bin
Once it is done, copy the following script in the /opt/power-tools/bin/board
file:
#!/bin/sh

# Information available at
#  - https://www-soc.lip6.fr/trac/soc-conso
#  - https://monolithe.proj.lip6.fr/admin_energy/

CR="$(printf '\r')"

BIN_DIR=/opt/power-tools/bin
BOARD_DIR=/opt/power-tools/boards
BOARD=
CMD=
VALUE=

usage() {
  echo "USAGE: $0 BOARD CMD [VALUE]"
  echo "Control the powerboard"
  echo ""
  echo "CMD"
  echo "  calibration  Return calibration data"
  echo "  help         Show this page"
  echo "  list         Return the list of boards connected"
  echo "  measure      Measure the power consumption of the board"
  echo "  power        Power on/off the board (VALUE = on|off)"
  echo "  reboot-pic   Reboot the powerboard"
  echo "  status       Return info of the board"
  echo "  switchX      Enable/disable the switch X (VALUE = on|off, X = 1|2)"
}

validtty() {
  TTY="$BOARD/tty"
  if ! [ -e "$TTY" ]; then
    echo "$0: Error: '$BOARD' is not a valid board" >&2
    exit 1
  fi
  if ! [ -r "$TTY" -a -w "$TTY" ]; then
    echo "$0: Error: You do not have permissions to access $BOARD" >&2
    exit 1
  fi
}

noval() {
  if [ -n "$VALUE" ]; then
    echo "$0: Error: Too many args" >&2
    usage >&2
    exit 1
  fi
}

switch() {
  s=
  case "$VALUE" in
    "on"|"1")
      s=1
      ;;
    "off"|"0")
      s=0
      ;;
    *)
      echo "$0: Error: '$VALUE' invalid value for $CMD command" >&2
      usage >&2
      exit 1
      ;;
  esac
  validtty
  exec $BIN_DIR/readtty_command $TTY "R${1}${s}"
}

while [ $# -ne 0 ]; do
  case "$1" in
    help|--help|-h)
      usage
      exit 0
      ;;
    list)
      ls -1 "$BOARD_DIR" | while IFS= read BOARD; do
        TTY="$BOARD_DIR/$BOARD/tty"
        if [ -r "$TTY" ]; then
          echo "$BOARD"
        fi
      done
      exit 0
      ;;
    --*)
      echo "$0: Error: Unknown option '$1'" >&2
      usage >&2
      exit 1
      ;;
    -*)
      echo "$0: Error: Unknown option '$1'" >&2
      usage >&2
      exit 1
      ;;
    *)
      if [ -z "$BOARD" ]; then
        case "$BOARD" in
          */*|/*|*/)
            BOARD="$1"
            ;;
          *)
            BOARD="$BOARD_DIR/$1"
            ;;
        esac
      elif [ -z "$CMD" ]; then
        CMD="$1"
      elif [ -z "$VALUE" ]; then
        VALUE="$1"
      else
        echo "$0: Error: Too many args" >&2
        usage >&2
        exit 1
      fi
      ;;
  esac
  shift
done

case "$CMD" in
  calibration)
    noval
    validtty
    exec $BIN_DIR/readtty_command $TTY "C"
    ;;
  measure)
    validtty
    c="$(cat "$BOARD/current" 2>/dev/null)"
    v="$(cat "$BOARD/tension" 2>/dev/null)"
    case "$c" in
      1|2|3|4) ;;
      *)
        echo "$0: Error: invalid current." >&2
        echo "$0: Please check the content of $BOARD/current" >&2
        exit 1
    esac
    case "$v" in
      1|2|3) ;;
      *)
        echo "$0: Error: invalid tension." >&2
        echo "$0: Please check the content of $BOARD/tension" >&2
        exit 1
    esac
    exec $BIN_DIR/readtty_power -c "$c" -v "$v" "$TTY"
    ;;
  power)
    p=
    case "$VALUE" in
      "on"|"1")
        p=1
        ;;
      "off"|"0")
        p=0
        ;;
      *)
        echo "$0: Error: '$VALUE' invalid value for power command" >&2
        usage >&2
        exit 1
        ;;
    esac
    validtty
    exec $BIN_DIR/readtty_command $TTY "P$p"
    ;;
  reboot-pic)
    noval
    validtty
    exec $BIN_DIR/readtty_command $TTY "E"
    ;;
  status)
    noval
    validtty
    exec $BIN_DIR/readtty_command $TTY "S"
    ;;
  switch1)
    switch 1
    ;;
  switch2)
    switch 2
    ;;
  *)
    echo "$0: Error: '$CMD' is not a valid command" >&2
    usage >&2
    exit 1
    ;;
esac
Add /opt/power-tools/bin folder in the path of the /etc/environment file.
Then, update the ownership and rights:
Next part is about the configuration of each measurement platform. Create a new folder dedicated to it:
For each board (from board1 to board9), create a folder that contains two files:
current and tension. The contents of these files has been explained in
a previous section:
for i in {1..9}; do sudo mkdir /opt/power-tools/boards/board$i; done
for i in {1..9}; do sudo touch /opt/power-tools/boards/board$i/current; done
for i in {1..9}; do sudo touch /opt/power-tools/boards/board$i/tension; done
Create symlinks for each board according to the table described before:
cd /opt/power-tools/boards/
sudo ln -s board1 xagx
sudo ln -s board2 xnano
sudo ln -s board3 vim1s
sudo ln -s board4 bpif3
sudo ln -s board5 xu4
sudo ln -s board6 rpi4
sudo ln -s board7 opi5
sudo ln -s board8 oagx
sudo ln -s board9 onano
Create symlinks in each board folder to the corresponding USB measurement platform according to their unique identifier:
sudo ln -s /dev/serial/by-id/usb-Microchip_Technology_Inc._MCP2200_USB_Serial_Port_Emulator_0002021219-if00 /opt/power-tools/boards/board1/tty
sudo ln -s /dev/serial/by-id/usb-Microchip_Technology_Inc._MCP2200_USB_Serial_Port_Emulator_0003224568-if00 /opt/power-tools/boards/board2/tty
sudo ln -s /dev/serial/by-id/usb-Microchip_Technology_Inc._MCP2200_USB_Serial_Port_Emulator_0003223749-if00 /opt/power-tools/boards/board3/tty
sudo ln -s /dev/serial/by-id/usb-Microchip_Technology_Inc._MCP2200_USB_Serial_Port_Emulator_0003224689-if00 /opt/power-tools/boards/board4/tty
sudo ln -s /dev/serial/by-id/usb-Microchip_Technology_Inc._MCP2200_USB_Serial_Port_Emulator_0003224814-if00 /opt/power-tools/boards/board5/tty
sudo ln -s /dev/serial/by-id/usb-Microchip_Technology_Inc._MCP2200_USB_Serial_Port_Emulator_0003223821-if00 /opt/power-tools/boards/board6/tty
sudo ln -s /dev/serial/by-id/usb-Microchip_Technology_Inc._MCP2200_USB_Serial_Port_Emulator_0003224800-if00 /opt/power-tools/boards/board7/tty
sudo ln -s /dev/serial/by-id/usb-Microchip_Technology_Inc._MCP2200_USB_Serial_Port_Emulator_0003227509-if00 /opt/power-tools/boards/board8/tty
sudo ln -s /dev/serial/by-id/usb-Microchip_Technology_Inc._MCP2200_USB_Serial_Port_Emulator_0003225238-if00 /opt/power-tools/boards/board9/tty
Info
As the identifiers are unique, they will stay the same independently of the computer on which the power tools are installed.
Set the right configuration for each board, this strongly depends on the table described before:
echo "4" | sudo tee /opt/power-tools/boards/board1/current
echo "3" | sudo tee /opt/power-tools/boards/board1/tension
echo "4" | sudo tee /opt/power-tools/boards/board2/current
echo "1" | sudo tee /opt/power-tools/boards/board2/tension
echo "2" | sudo tee /opt/power-tools/boards/board3/current
echo "1" | sudo tee /opt/power-tools/boards/board3/tension
echo "4" | sudo tee /opt/power-tools/boards/board4/current
echo "3" | sudo tee /opt/power-tools/boards/board4/tension
echo "4" | sudo tee /opt/power-tools/boards/board5/current
echo "1" | sudo tee /opt/power-tools/boards/board5/tension
echo "4" | sudo tee /opt/power-tools/boards/board6/current
echo "2" | sudo tee /opt/power-tools/boards/board6/tension
echo "4" | sudo tee /opt/power-tools/boards/board7/current
echo "1" | sudo tee /opt/power-tools/boards/board7/tension
echo "4" | sudo tee /opt/power-tools/boards/board8/current
echo "3" | sudo tee /opt/power-tools/boards/board8/tension
echo "3" | sudo tee /opt/power-tools/boards/board9/current
echo "3" | sudo tee /opt/power-tools/boards/board9/tension
Install powerstat on x86-based SBCs
On the EM780 (Ubuntu 24.04 LTS) and on the X7Ti (Ubuntu 24.10) you need to
install powerstat from apt as follow:
To use powerstat in user mode:
sudo apt install sysfsutils
sudo chmod -R a+r /sys/class/powercap/intel-rapl
echo "mode class/powercap/intel-rapl:0/energy_uj = 0444" | sudo tee --append /etc/sysfs.conf
Run powerstat in user mode: